Many humanitarian organizations spend a considerable amount of time and effort on complex geospatial tasks that all too often don’t deliver the expected results. The disaster risk management toolkit gets larger everyday with the increased availability and accuracy of new satellite remote sensing (RS) products and enhanced capabilities through Artificial Intelligence (AI). It’s critically important that we focus our energy on design and efficiency concerns, and sift through the abundant, cutting-edge geospatial data analytics available to ensure we select the right data for the right job.
To set hazard exposure baselines, and anticipatory activation thresholds, geographical information systems (GIS) are used with a mixture of input data that comes from satellite RS, climate models, and socio-economic data from the ground. However, since the data and methods vary, the analyses used to set these baselines and thresholds often yield divergent outcomes. Apart from more technical questions involving the type and use of input data and analysis methods, there are other, perhaps more easily avoidable issues, that create inefficiencies.
Designing Hazard Exposure Baselines for AA
According to the Webster Dictionary, to design means “to create, fashion, execute, or construct according to plan.”Designing something means undergoing a creative process that precedes, transcends, and in some cases, disrupts the linear analytical process involved in the execution of a plan or the management of an event. Design has a more creative component, and I would argue that it gives a broader vision than planning or management processes.
Design might feel like something of a luxury in the context of AA or disaster response and management. However, we lose out if broader concepts of creative thinking in the design process of AA projects are overlooked. In particular, design thinking can enhance the geospatial analysis that forms the bedrock of AA projects; from investigating hazard models to setting hazard exposure baselines and describing in spatial granularity the resilience of populations. While technical expertise is indispensable for working with GIS, RS, and climate model data, it’s also critically important to develop a plan using a creative design process that involves a multidisciplinary team of experts representing different disciplines and areas of consideration: technical, research, programmatic, project management, and local stakeholders. Often, the components of AA projects are treated as separate sub-projects, prepared by separate teams.
... design thinking can enhance the geospatial analysis that forms the bedrock of AA projects; from investigating hazard models to setting hazard exposure baselines and describing in spatial granularity the resilience of populations.
Multidisciplinary teams support the cross-pollination of ideas, improve quality control, and offer a more creative (and productive) approach in the brainstorming and draft phases of a new project. They also have an additional advantage: they can help navigate the many, often contradictory, definitions and connotations related to AA, helping to disentangle jargon and focus instead on providing more effective support for beneficiaries. Although geospatial, data, climate, and hazard experts might be the focal points of the process, their work is enhanced when different voices (and skills) are brought to the table. A more diverse team can also help to ensure that any gender bias is reduced. Finally, local stakeholder participation and knowledge is critical, clearly illustrated in the Philippines case study below.
During a design process ideas are brainstormed in an ‘expansion’ or divergent phase, where different scenarios are suggested and explored, followed by a ‘contraction’ or convergence phase, during which ideas are judged according to their validity, feasibility, and potential to help meet the goals of the project. Ideas that fail to meet this test are eliminated. This approach is used across different fields and should also be used to guide the selection of data and the methods that are used to set the baselines of hazard exposure, as well as the methods of analysis.
In sum, the design process should equally take into consideration the following three elements:
- The goals of the project
- The analysis of the positive and negative impacts of mis-calculated baselines and thresholds; in other words estimating what potential impact the AA baseline and trigger inaccuracy could have on people and property, and
- The budget and timelines of the project.
When It Comes to Data Analysis, Do Not Allow Perfection to Become the Enemy of Progress
Any scientific problem has a spectrum of possible explanations. Some are reductive and simplistic; others are more complex and nuanced and provide dissertation-level specificity. Projects rely on experts to decide which level of complexity to adopt in the research of hazard exposure baselines and thresholds for action. However, in many cases, experts in a field have divergent views on how to best tackle a given scientific question, which in turn means that the same project or organization can expect different analyses and results depending on the technical team that is working on the project. In addition, there needs to be clarity on what level of analysis is feasible to obtain the best possible results, given the constraints of all three of the design considerations mentioned above.
Projects rely on experts to decide which level of complexity to adopt in the research of hazard exposure baselines and thresholds for action. However, in many cases, experts in a field have divergent views on how to best tackle a given scientific question ...
In this context, there are several design strategies that may improve the time and cost efficiency with which scientific analyses are undertaken and fed into the larger design architecture of AA initiatives.
Science Communication: A thematic expert that has the capacity to clearly idealize and present concepts to a broader project team can drastically improve the quality (accuracy and results), the efficiency (pace and cost effectiveness), and the uptake of analytical results related to an AA project.
Focusing on the 80/20 rule: The 80/20 rule, more formally known as the Pareto principle, broadly states: 80 per cent of the outcomes come from 20 per cent of causes. This rule-of-thumb adage has come to mean different things in different sectors, but essentially, it suggests that a minority of the work (the 20 per cent) is capable of producing the majority of the outcome (the 80 per cent). The opposite is equally true: 80 per cent of the work is responsible for achieving only the last 20 per cent of the outcome. In other words, the vast majority of the work is put in to perfect the product. This certainly rings true in RS, where a good product is one that hovers around or breaks the 80 per cent accuracy threshold. As far as geospatial applications goes, then, where the goal is always to make representations, or approximations, of the real world, we can say that investing the majority of resources in an attempt to perfect the imperfect does not produce the optimal result.
This last concept is simply another way of saying ‘don’t allow perfection to become the enemy of progress.’ One should strive for a good outcome, and keep developing from there as resources permit. If there’s time and money to improve a product, great, but a project should not be hindered or stifled by an inability to reach a ‘perfect’ outcome. Furthermore, it would be an even greater hindrance to assume, or plan, from the outset, that a certain unachievable level of accuracy should be the target goal of a project.
Triaging data and methods: A ‘triage’ mentality is always useful when technical data analyses are embarked upon. This is also known as an exploratory phase, which, far from being a waste of time, can actually end up accelerating things over the long term. It ensures there is no reinventing of the wheel, adopting a process of discovering, valuing, and enhancing the existing science and tools. This phase can also protect the project from utopian moonshots that deplete resources, while also providing proof of concept and pilot ideas that can help to identify realistic project objectives. To some, although terms such as ‘exploratory phase’ or ‘literature review’ sound antithetical to the often-purported goal of providing a ‘disruptive’ solution, in reality these steps ensure due-diligence and wiser solutions.
This brings us back to the importance of science communication skills: metabolizing and explaining to a broader group or audience the rationale of the 80/20 rule, triaging, data exploration and piloting, and when applying specific input data selection or methodologies is not trivial but necessary for success.
This last point also underscores the need for an additional consideration. We know that behavioral psychology has a big impact on early warning and disaster risk management, but what can behavioral psychology teach us that can improve the design of an AA project and the success for its beneficiaries?
Data Exploration: Learning from the Experiences of an AA Project in the Philippines
Some of the concepts introduced above, when applied at the very start of a project, can lead to significant gains, as illustrated in the following example from the Philippines. In 2021, I provided support to an AA project that was being proposed by the WFP. Geospatial analysis was already being applied by a Vulnerability and Analysis Mapping (VAM) unit, and more was being done by a regional unit in modeling climate hazards (typhoons specifically) and understanding population exposure. Together, this complex array of analyses was being fed into a broader project proposal. My role was to explore some of the key variables of typhoon-related hazard exposure within several target geographical areas.
Using tools such as earthmap.org (developed by the Food and Agriculture Organization of the UN) helped us visualize available satellite RS data for target areas, and a broad literature review helped us understand what analyses might have already been done. In close cooperation with the Philippines VAM team, we consolidated existing datasets from national agencies and identified what projects and analyses had already been implemented. In a relatively short amount of time the triage phase was sufficiently complete to pinpoint a few geospatial datasets that could provide the optimal tool.
Other datasets were scrapped quickly and our analysis was able to focus on three specific geospatial layers:
- Municipal administrative units.
- Binary mask of settlement area from the World Settlement Footprint 2019. These are areas occupied by buildings that are observable from satellites, in this case, Sentinel 1 and 2 from the European Space Agency. Areas are classified into a binary mask at 10m resolution; or in other words categorized as either ‘building’ or ‘non-building’ by a machine learning method applied to the satellite data provided by the German Space Agency.
- Elevation from the NASA Shuttle Radar Topography Mission (SRTM) Digital Elevation Model (DEM), SRTMGL1. This DEM product has a pixel (cell) resolution of 30m and has global coverage. It is often used in projects where a localized and higher resolution DEM is not readily obtainable, and provides a highly-accurate source for both elevation data, and the derivable information on slope (in degrees).
With these three layers, it was possible to relatively quickly explore the likelihood of typhoon-related direct hazards (such as coastal flooding) and co-hazards (such as precipitation-induced landslides) in specific built-up areas where people lived. For example:
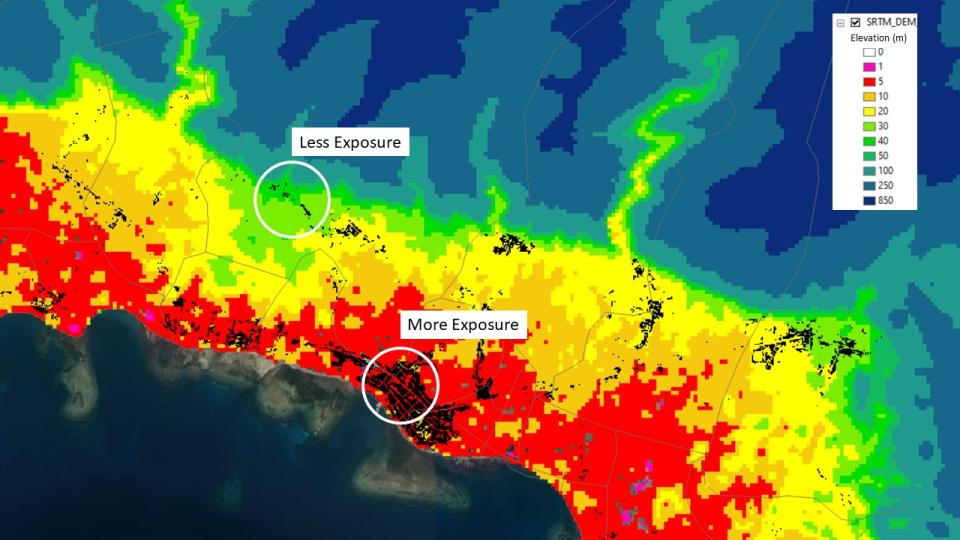
The raw elevation data together with the building footprint gave us an understanding of which communities (and how many people) lived in areas most prone to river flooding (Figure 1).
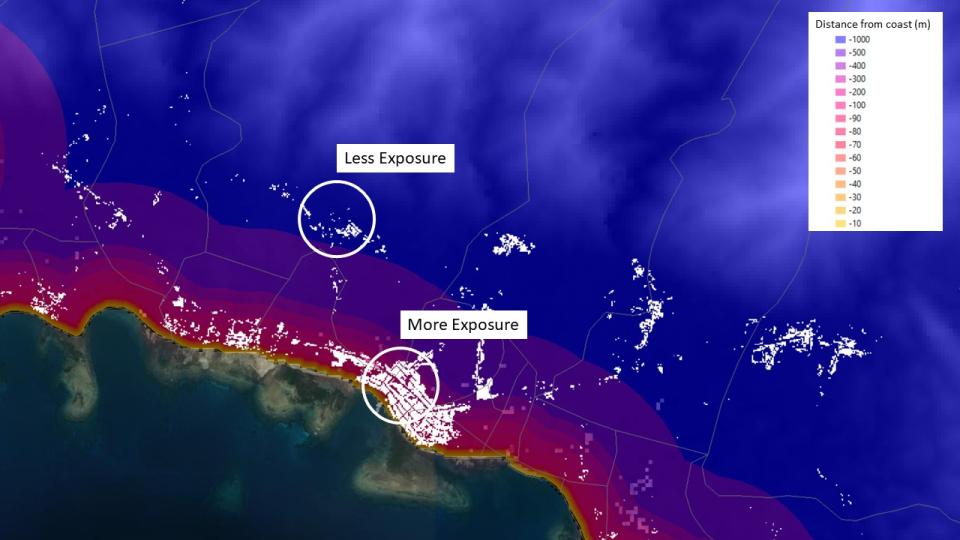
A buffer analysis using the administrative polygons and the building footprint gave us an idea of how many people lived within a certain proximity to the ocean, and thus were more exposed to potential coastal flooding (Figure 2).
Finally, an analysis of building slope, the terrain gradient on which settlements are built on, gave us an idea of which buildings might be more exposed to potential landslides (Figure 3).
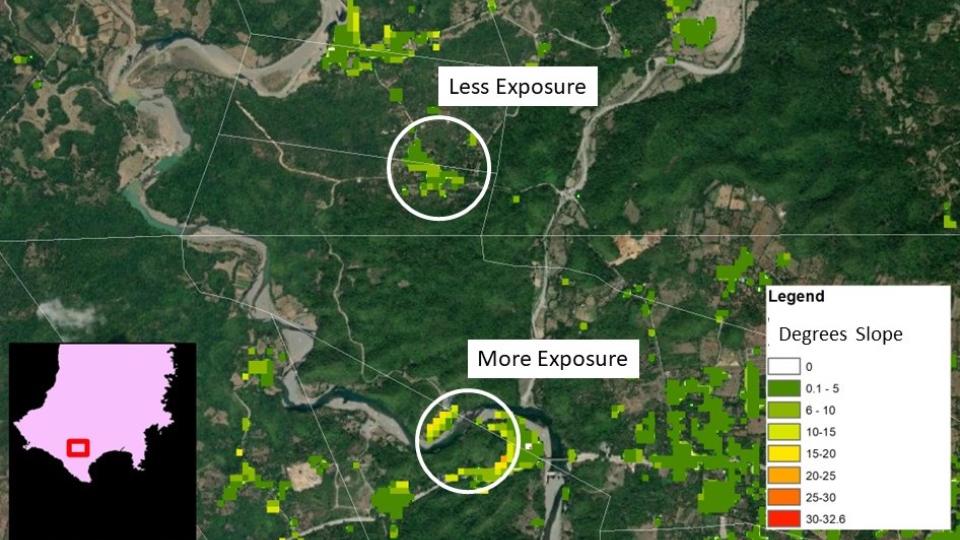
Although the above data explorations constituted just an analytical proof of concept, and could be improved and made more accurate, the analysis was sufficient to point us in the right direction and provide useful information.The analysis also found that approximately 10–20 per cent of the municipalities in the study area that were not already included on a list of potential target beneficiaries were in fact highly susceptible to typhoon-related co-hazards. At the very least, this data exploration illustrated how using different data and parameters can have a significant impact on who is, and who is not, included as a beneficiary in a disaster prevention initiative.
As the climate crisis intensifies, it is vitally important that humanitarian organizations harness the potential of geospatial analysis to protect the lives and livelihoods of those most vulnerable to disasters and extreme weather events. Despite challenges related to the design and efficiency of GIS-based distaser management tools, there are approaches, outlined in this article, that humanitarians can adopt to ensure responses are quicker and more precisely targeted. In climate-vulnerable communities in the Philippines, for example, carefully thought-out principles of design, due diligence, and efficiency were applied to identify previously overlooked households at-risk from typhoon co-hazards. The lessons learned through this process, if adopted, could inform approaches elsewhere – helping to extend and strengthen disaster resilience and ultimately reduce death and suffering.
Suggested citation: Giuseppe Molinario., "Improving the Design of Geospatial Analysis for Anticipatory Action," UNU-CPR (blog), 2023-08-29, 2023, https://unu.edu/cpr/blog-post/improving-design-geospatial-analysis-anticipatory-action.

